In the series: Note 11.
Subject: Functions with more than one variables, like f(x,y) or f(x,y,z)
Date : 4 June, 2016Version: 0.3
By: Albert van der Sel
Doc. Number: Note 11.
For who: for beginners.
Remark: Please refresh the page to see any updates.
Status: Ready.
This note is especially for beginners.
Maybe you need to pick up "some" basic "mathematics" rather quickly.
So really..., my emphasis is on "rather quickly".
So, I am really not sure of it, but I hope that this note can be of use.
Ofcourse, I hope you like my "style" and try the note anyway.
This note: Note 11: Functions with more than one variables, like f(x,y) or f(x,y,z).
Each note in this series, is build "on top" of the preceding ones.
Please be sure that you are on a "level" at least equivalent to the contents up to, and including, note 10.
This is a simple and short note on functions with more than one variable, like z=f(x,y).
1. Introduction.
In the former notes we have seen functions in the form y=f(x), which usually correspond with a line, orcurve (for example, a parabola), in the 2 dimensional XY plane.
Ofcourse, using the x,y coordinate system (the XY plane), is a mere convention. In math, we are simply
accustomed to use the letters "x" and "y". There is absolutely no fundamental difference, if we would replace "x"
with for example the letter "t". Indeed, suppose we have a function with respect to "time", then it would
be more natural to denote the function as y=f(t). Ofcourse, you can also replace the "y" with another,
more appropriate, symbol. It makes no difference at all.
Now, having a function depending on more than one variable, is a difference indeed.
For example, we may have a function z=f(x,y) where z is dependent on two variables (x and y).
Or, we may have a function w=f(x,y,z) where w is dependent on three variables (x and y and z).
And we can even have any number of variables, like "n" variables as in the function r=f(x1, x2, ..., xN).
Just like a function z=f(x) correspond to one dimensional curve in two dimensional space (the XY plane),
a function in the form z=f(x,y), often correspond a "surface" in three dimensional space.
That's why those functions "z=f(x,y)" are relatively easy to "graph" in an XYZ coordinate system.
Indeed, just like we had an x- and y-axis with the XY coordinate system (the XY plane), we now use
an x- and y- and z-axis.
You may also say that functions (or relations) like z=f(x,y) are functions (or relations) that fall in
the class R2 -> R, since points (x,y), which are in the XY plane, are "mapped" to "z" on the z-axis.
This way, a "surface" in 3D space appears.
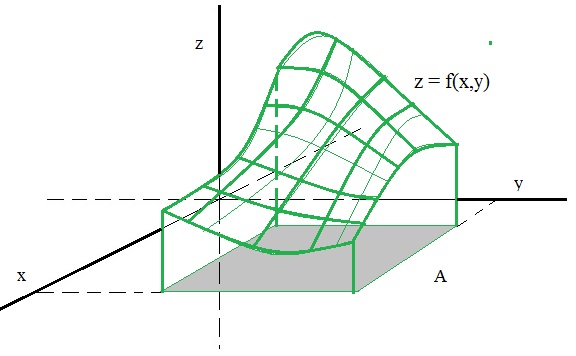
In figure 1, I try to illustrate this fact. We can see a surface, since all the (x,y) points in the functions domain,
are mapped to a certain z-value. The connection of all those z-values form a "smooth" continuous surface.
(However, "smoothness" is not garantueed ofcourse with all sorts of possible z=f(x,y) functions/relations).
Figure 1. Just some z=f(x,y) example function. In this case, we see a two dimensional "surface" in three dimensional space.

Let's inspect a well-known z=f(x,y) function.
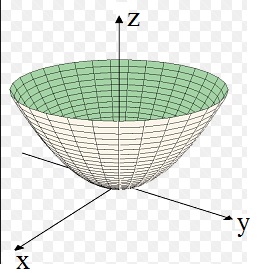
Take a look at figure 2. Here we have the function z = f(x,y) = x2 + y2
Figure 2. An example of a two dimensional "surface" (a parabola) in three dimensional space.

It's easy to proof that this example is a two dimensional surface (a curved surface in 3D space), in the form of a parabola.
Just imagine that the x-axis does not exist. Then we have only the projection of the surface on
the YZ plane. That is no more than the familiar parabola we have seen in note 3. In fact, we have z= y2.
Next, imagine that the y-axis does not exist. Then we are only left with the projection of the surface on
the XZ plane. Again, that is no more than the familiar parabola we have seen in note 3. In fact, we have z= x2.
The surfaces in more dimensions, like "w=f(x,y,z)", cannot be graphed anymore. For that to happen, we would need a
coordinate system with an x-, y-, z-, w-axis, and we simply have difficulties in creating a mental picture for that.
However, mathematically, using 2 axis (2 dim space which is a plane), 3 axis (3 dim space as we know it),
or "N" axis (N dimensional space), is not a problem at all.
In the next sections, we will spend a few words on f(x,y) and f(x,y,z) functions (or relations).
Note:
About 2 dimensional and 3 dimensional figures: If you look at figure 1 again, most folks would say that they see
a three dimensional figure. In contrast, I would say that it is a 2 dimensional surface in 3D space. However, I do not consider
this to be a real "issue". So, if you like, like most do, call it a three dimensional parabola.
2. Some example of "z=f(x,y)" functions (or relations).
2.1 The Ellipsoid and Sphere:
Suppose we have a Sphere centered around the Origin. By the way, the "origin" of our (x,y,z) space, is that unique point,where the x-, y- and z-axis intersect.
For a Sphere it holds, that for every point on that surface, the distance to the origin is exactly the same.
So, suppose the "radius" of the Sphere is "r", then it must hold that:
x2 + y2 + z2 = r2 (equation 1)
If you do not see that this equation really holds, then I tell you that it's actually can be seenfrom the good old "Pythagorean theorem", which you might know from the right-angled triangle (a2 + b2=c2).
You can apply the "Pythagorean theorem" here too ! Hence x2 + y2 + z2 = r2
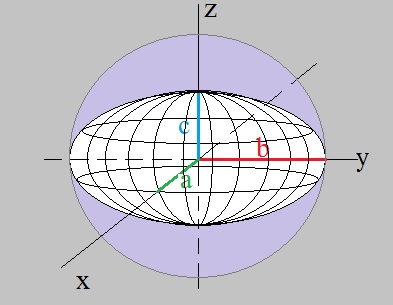
An ellipsoid looks like an american football. There is no uniform radius, but instead, the surface crosses
the x-, y- and z-axis with a "distance" of a, b, and c respectively.
Figure 3. An example of an "ellipsoid". If a=b=c, then it's a Sphere.

The relation which describes any point on the surface, is:
| x2 --- a2 |
+ | y2 --- b2 |
+ | z2 --- c2 |
= 1 (equation 2) |
To "proof" to upper relation, suppose the following happens: Try to make a mental picture of the following:
- the length "a" gets closer and closer to "r", and
- the length "b" gets closer and closer to "r", and
- the length "c" closer and closer to "r".
Here ofcourse, "r" is the radius of a Sphere, where a, b, and c, all three, get closer to.
With this reasoning, then the upper relation gets closer and closer to the following:
x2 / r2 + y2 / r2 + z2 / r2 = 1
which is:
1/r2 (x2 + y2 + z2) = 1
which is:
x2 + y2 + z2 = r2
That's the equation of a Sphere. We know that one already. So equation 2 "goes to" equation 1, if
a, b, and c "goes to" r.
So, the other way around is likely, since the reasoning above, is plausible.
Alright, it's not exactly "proof", but merely a way to make matters "likely to be correct".
2.2 Paraboloids:
Let's again take a closer look at 3 Dimensional Parabolas. Often, they are called "Paraboloids".The "semi-general" equation for a socalled "Elliptic" Paraboloid is:
z=ax2 + by2 +c (equation 3)
Where a, b and c are constants.The values of a , b and c, define the "shape" and location of the Paraboloid.
Let's take a look at "c" first.
Suppose we have the parabola from figure 2: f(x,y)=x2 + y2
Suppose we now have f(x,y)=x2 + y2 - 3, so we have "c"=-3.
Then the "nose" of the parabola, is at (0,0,-3) (or x=0, y=0, z=-3).
You may say that the whole parabola has "sunk" along the z-axis by 3 units.
Suppose we now have f(x,y)=x2 + y2 + 5, so we have "c"=5.
Then the "nose" of the parabola, is at (0,0,5) (or x=0, y=0, z=5).
You may say that the whole parabola has "risen" along the z-axis by 5 units.
Now, let's take a look at "a" and "b".
"a" and "b" very strongly define the shape of the parabola.
- We have an "Elliptic" Paraboloid when "a" and "b" have the same sign. This is the one that resembles
a 3D variant of the familiar 2D parabola.
- We have a socalled "Hyperbolic" Paraboloid when "a" and "b" have different signs. This one resembles a "sadle".
In the latter case (the "saddle" shape), the surface resembles even more a 3D hyperbola.
Due to the large variations in shapes, equation 3 is not really "general", in the sense that it really covers all cases.
But this note is no more than a quick introduction, so I further skip complexities in this phase...
2.3 A flat surface (a plane) in XYZ space (R3):
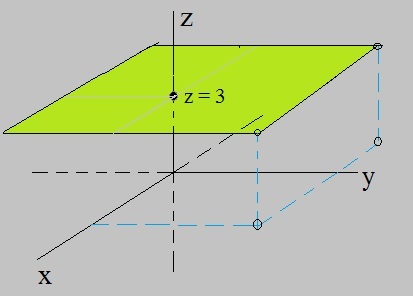
What is the general equation of a "straight" plane in R3?In figure 4, you see one of the most simplest examples. It's a plane parallel to the XY plane.
In this particular example, the plane intersects the z-axis at (0,0,3).
It never crosses the XY plane, since it is parallel to that plane.
In this example, it is really sufficient to say that the relation is "z=3".
Or, in other words, for all x and y, it is true that z equates to "3".
Figure 4. An example of a plane in three dimensional space.

I tell you, that when we will work with "vector calculus" (note 16), a new and much simpler "world" will open up.
For now, we are dealing with regular Calculus.
I propose (and will make likely) that the mathematical relation for a plane in R3 is:
ax + by + cz = d (equation 4)
And you can easily rewrite equation 4 in the form "z=f(x,y)=", since that is no more than some arithmetic.So, if you like, "z=fx + gy +h", where I have used different coefficients (which is allowed ofcourse).
But since many textbooks and articles use equation 4, I did the same.
Note that the relation is a linear equation, just like "y=ax+b", which we know from note 2.
So, for the equation "z=3", as illustrated in figure 4, we may write "z=0x + 0y + 3".
It seems that if the coefficients used for "x" and "y", when they both are "0", we have a parallel plane.
Now, just as with "y=ax+b", it is true that "a" determines the "slope" or "gradient" of that line.
It's really no different with a plane expressed by "z=fx + gy +h".
Suppose the coefficients "f" and "g" both are > 0, and "f" > "g", then you see what happens?
The plane gets a slope as well, and since "fx" goes faster up than "gy", z increases more when measured along "x".
So, in this case, we have a tilted plane going upwards when x and y both are >0, but more strongly so along x.
Here is an example of a plane with a "slope": z = 3x + 5y
Why do we know that this plane goes through the Origin? Well, if x=0 and y=0, then z=0 too.
So the point (0,0,0) is in that plane,
2.4 A straight line in R3:
You might think that this should be the most easy one of all.It is..., in vector calculus.
In ordinary analysis, the equation is not so very straight forward and intuitive.
In vector form (we will see all about it in note 16), it is:
(x,y,z)=(x0,y0,z0) + t (a,b,c)
where (x0,y0,z0) describes some point on that line, "t" is a variable,
and (a,b,c) is some specific vector, defining a specific direction (namely, that of the line) in R3.
Again, we will see all about it. Also parametric forms will bee shown in note 12.
Ofcourse, a line can also be described as the intersection of 2 planes, like:
{all points (x,y,z) for which hold that: a1x + b1y + c1z = d1 ∧ a2x + b2y + c2z = d2}
Don't worry. This is for note 16.
3. The derivatives of z=f(x,y).
In note 5, we explored the theory of finding the "derivative" of a function in the form y=f(x).We essentially wanted to find the rate of change of f(x), compared to the the rate of change of "x".
Indeed, here we had only one variable, so we only could inspect the variation in f(x), when x varies.
In many cases, we were able to find the derivative function f '(x), which we also wrote as:
| f '(x)= | d f(x) ----- (equation 5) dx |
An important interpretation was, that for all x, that f '(x) corresponds to the "gradient" (slope)
of the tangent line to f(x). If that all is a bit fuzzy, maybe you want to review note 5 again.
Here, with functions z=f(x,y), we have a similar situation.
Since f(x,y) depends on two variables, we may compare the change in f(x,y) in two waysL
(1), We may try to find the rate of change of f(x,y), compared to the the rate of change of "x", or
(2). We may try to find the rate of change of f(x,y), compared to the the rate of change of "y".
Usually, the statements above are written as "partial differentials":
| ∂ f(x,y) ------- (equation 6) ∂ x |
and
| ∂ f(x,y) ------- (equation 7) ∂ y |
You might think that the partial derivatives, correspond to a tangent plane to a point
on the graph of f(x,y). It's not a bad interpretation, in many cases, but there is a catch.
The catch is this:
If you analyze the rate of change of f(x,y), compared to the the rate of change of "x", then you assume
that y is constant. This might be some sort of problem.
The problem is not difficult to visualize. If f(x,y) is some curved surface, and "x" varies, and that change might be very small,
then still "y" changes too !
So, usually, the partial derivatives are dealt with in the following way:
If you deal with ∂ f(x,y) / ∂ x, then you consider "y" to be constant, like y=b.
If you deal with ∂ f(x,y) / ∂ y, then you consider "x" to be constant, like x=a.
In such a way, the interpretations are the gradients of tangent lines in the x- or y- directions.
To calculate the partial derivatives is then easy. It's just like calculating an the derivative of one-variable function.
If you say: "I still have an problem, since is it not so that if you for example calculate ∂ f(x,y) / ∂ x,
then y still will always vary?"
Yes and No. In your example above, we take a fixed y, like y=b, and simply only focus on the variation in "x".
And since the true derivative in a point, is the limit of Limh->0 f(x+h,b) / h,
we are indeed able to focus on the rate of change of "f" compared to the rate of change in "x" only.
If you still have some reservations, I understand, but you must know that the "full" or "total" derivative
takes into account all variations, so for "x+h" and "y+h" simultaniously.
Example of a partial derivative:
Suppose f(x,y) = x2y3. Determine the partial derivative of f(x,y) for x, where y=b.
∂ f(x,b) / ∂ x = ∂ x2b3 / ∂ x = 2xb3=2b3 x.
I pospone the discussion of the "full" or "total" derivative (which takes into account all variations,
so for "x+h" and "y+h" simultaniously) to a later note.
Anyway, the partial differentials of a function, and "partial differential equations", play a key role in math and physics.
Especially in physics. Countless examples exist. For example, we often are involved in functions like f(x,t),
where "x" represents a spatial position, and "t" is time. Physicists often want to know and use the partial differentials
with respect to position and time, which gives them insight in the behaviour of a physical system.
4. Intersections of f(x,y) with the coordinate axes of x, y, and z.
In note 6, we analyzed functions of the form y=f(x).That investigation was about (among other things), finding the intersections of the function with the x- and y-axis,
and finding the minima and maxima of the function (if present).
Since the function z=f(x,y) is most often some surface in R3, we can do a similar analysis here.
Really a similar approach can be used as we already saw in note 6.
Indeed, where f(x,y) has a local maximum or minimum, clearly the tangent lines must be horizontal, so here too
the partial differentials must be "0". From those relations, the corresponding "x's" and "y's" can be calculated.
Also, the points where f(x,y) crosses the x-, y-, and z-axis (if it does so) can be derived as well, since:
Intersection with the z-axis: then x and y are "0".
Intersection with the x-axis: then y and z are "0".
Intersection with the y-axis: then x and z are "0".
This generally gives us a means to calculate the corresponding points.
5. A few words on a function or relation with 3 variables: f(x,y,z).
The function z=f(x,y), most often corresponds to a "surface" in three dimensional space.We often view it, as that points (x,y) are mapped to z, which leads to a surface (like the parabola in fig 1).
What about functions like w=f(x,y,z)? Here w is dependent on 3 variables.
We cannot graph that anymore, since we now need 4 spatial dimensions, namely x, y, z, and w.
We have to be carefull before we think we can associate surfaces or volumes to such functions.
Still, those functions, or relations, are often used in physics.
Suppose we have a region with a certain 'potential'. At every point (x,y.z) in Space, we can then
attribute a certain magnitude of that potential (potential energy, pressure, or other sort of potential).
It might vary slowly or rather fast between small distances of two arbitrary points (x1,y1,z1) and (x2,y2,z2).
Such function are often called 'scalar' functions, since w=f(x,y,z) is simply a number.
By the way, in the case of z=f(x,y), z is simply a number too, so here too we may call them scalar functions.
Calculating the partial derivatives is done in the same way as was demonstrated in section 3.
Suppose we have the function φ(x,y,z) = 3x2y - y3z
Take note of the fact that on the right side of the "=" symbol, that we see an expression of "x", "y", and "z".
Again, it's a scalar function, meaning that the function values are real numbers again.
As a slightly different interpretation of such a function: x,y,z represents a point in "space", and maybe φ(x,y,z)
defines some "field", depended on the points (x,y,z), and it's value per point in space just happens to be 3x2y - y3z
Since I want this to be a very short note (it's just a mere introduction), I will move on to note 12.
Remark 18 sept 2016: the theory presented here, will be covered in a little more "depth", in note 17.